NinjaOne End-User Access Report

Every end-user account, what it can reach, and whether it is still being used.

It reads the NinjaOne Public API v2 with a read-only credential and assembles every end-user account across every organization into one interactive HTML report: who exists, which devices each account can reach (classified against the organization’s own inventory), what roles it holds and where they came from, whether its invitation was ever accepted, and its full portal sign-in history from the retained activity log. Each run diffs against your previous run, and a history page compares any two runs. Run it on demand or on a schedule.
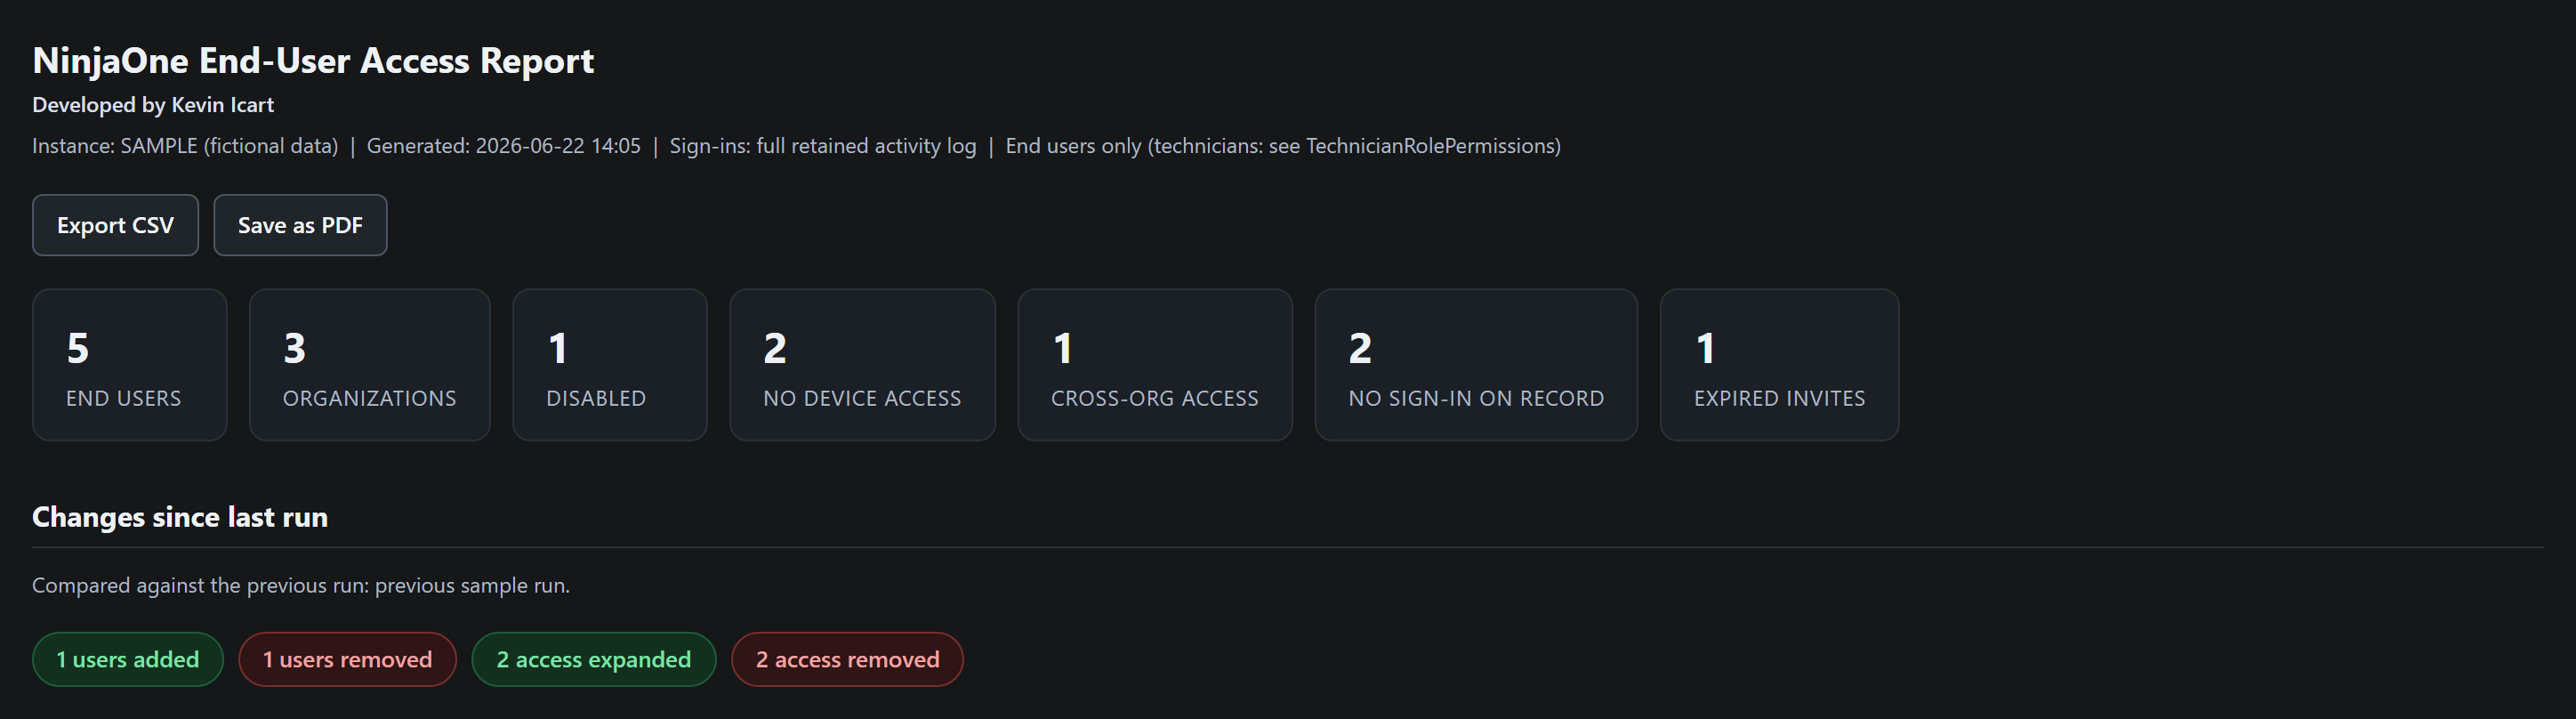
Top of the report: summary cards counting end users, organizations, disabled accounts, no device access, cross-org access, no sign-in on record, and expired invites, above a changes-since-last-run banner.

The gap

End users are managed one organization at a time.

NinjaOne shows end-user accounts inside each organization, but there is no single cross-organization view of who exists, what devices they can reach, or whether they still sign in - and the user objects carry no last-login field at all. For a provider managing dozens of client organizations, an access review means clicking through every org and still not knowing which accounts are dormant. The tool assembles that entire picture in one read-only pass: the account facts from the user endpoints, and the sign-in story recovered from NinjaOne’s own activity log.

What it does

Four jobs, one self-contained file.

Every capability below is visible in the screenshots - there is no dashboard to host, no database, and no agent on client devices. Each run writes one HTML file you can open, archive, or email, plus CSV and JSON exports of the same data.

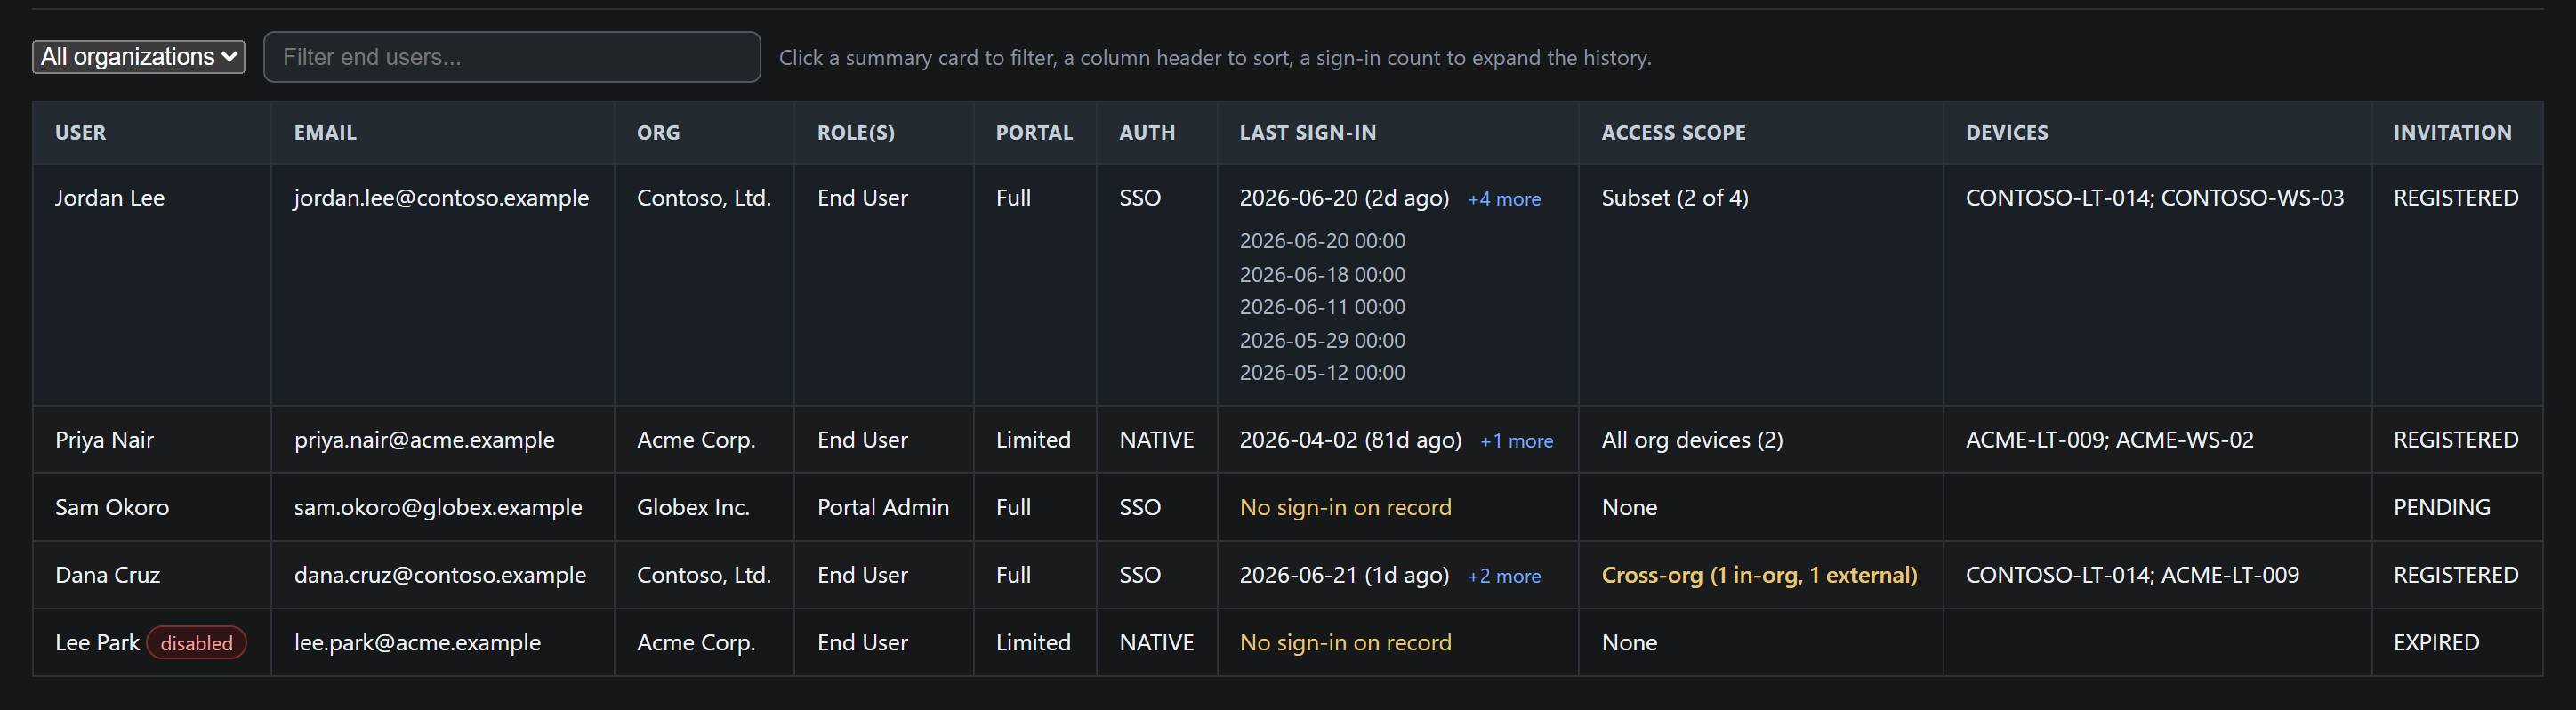
End-user table with organization dropdown, text filter, sortable columns, an expanded per-user sign-in history, and access scope labels including Subset, All org devices, Cross-org, and None.
Inventory

Access scope, classified per account

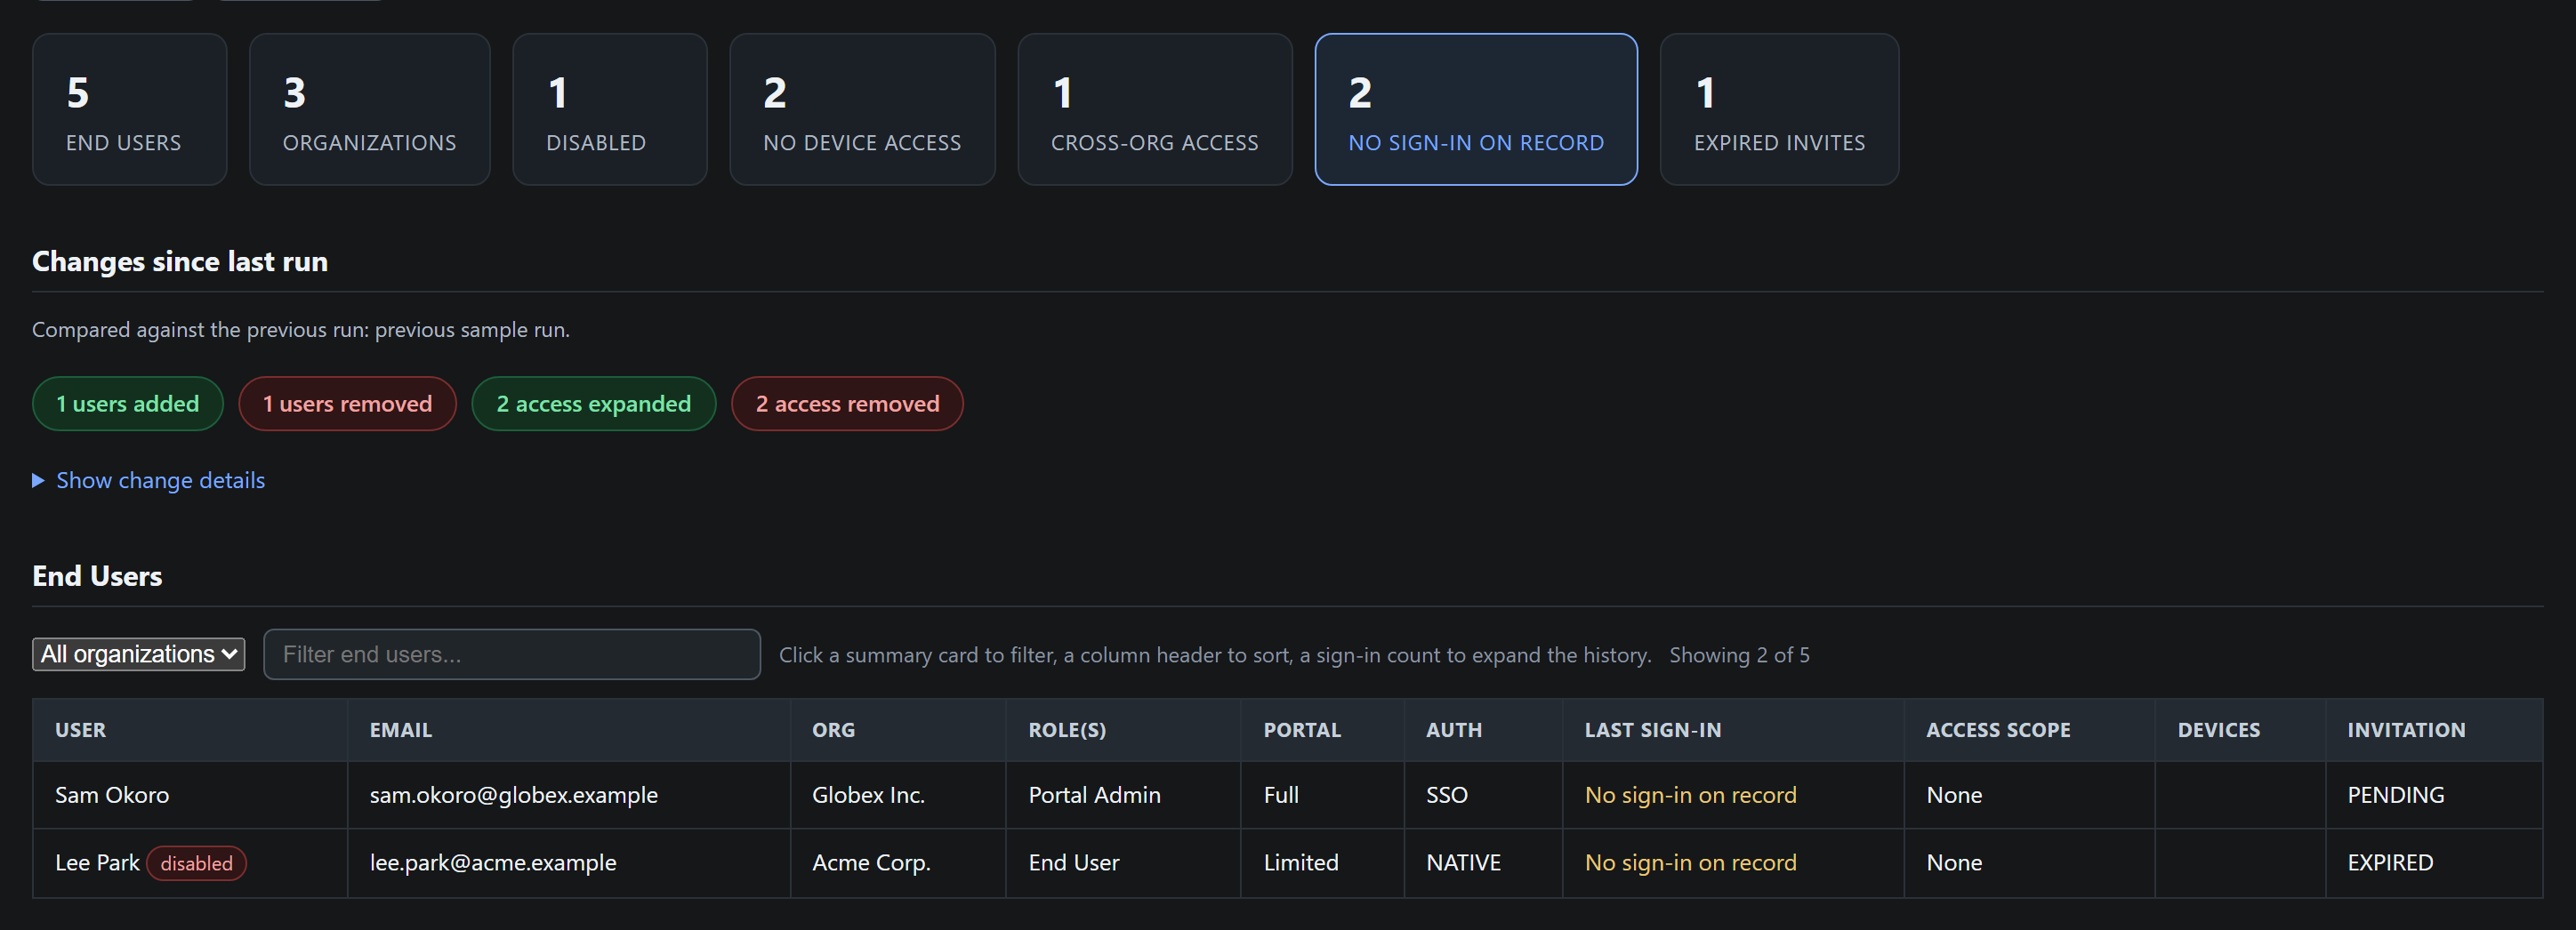
What it does: lists every end user with organization, roles (and whether each came from direct assignment or SSO/SCIM), portal level, auth type, invitation status, and devices - classified against the org’s own inventory as Subset (N of M), All org devices, Cross-org, Other org, Unresolved, or None.

What it gives you: the exceptional states stand out - a user whose access spans more than one organization is flagged, and the healthy least-privilege norm reads as exactly that. Click any sign-in count to expand that account’s full history.

A summary card acting as a live filter: No sign-in on record is highlighted and the table below shows only the two matching accounts with a Showing 2 of 5 counter.
Triage

Summary cards that filter the table

What it does: the headline counts - disabled, no device access, cross-org access, no sign-in on record, expired invites - are clickable filters, and an organization dropdown plus a free-text filter stack on top.

What it gives you: one click turns “53 users with no sign-in on record” from a number into the actual list, and Export CSV downloads exactly the filtered view - the deprovisioning list, ready to hand off.

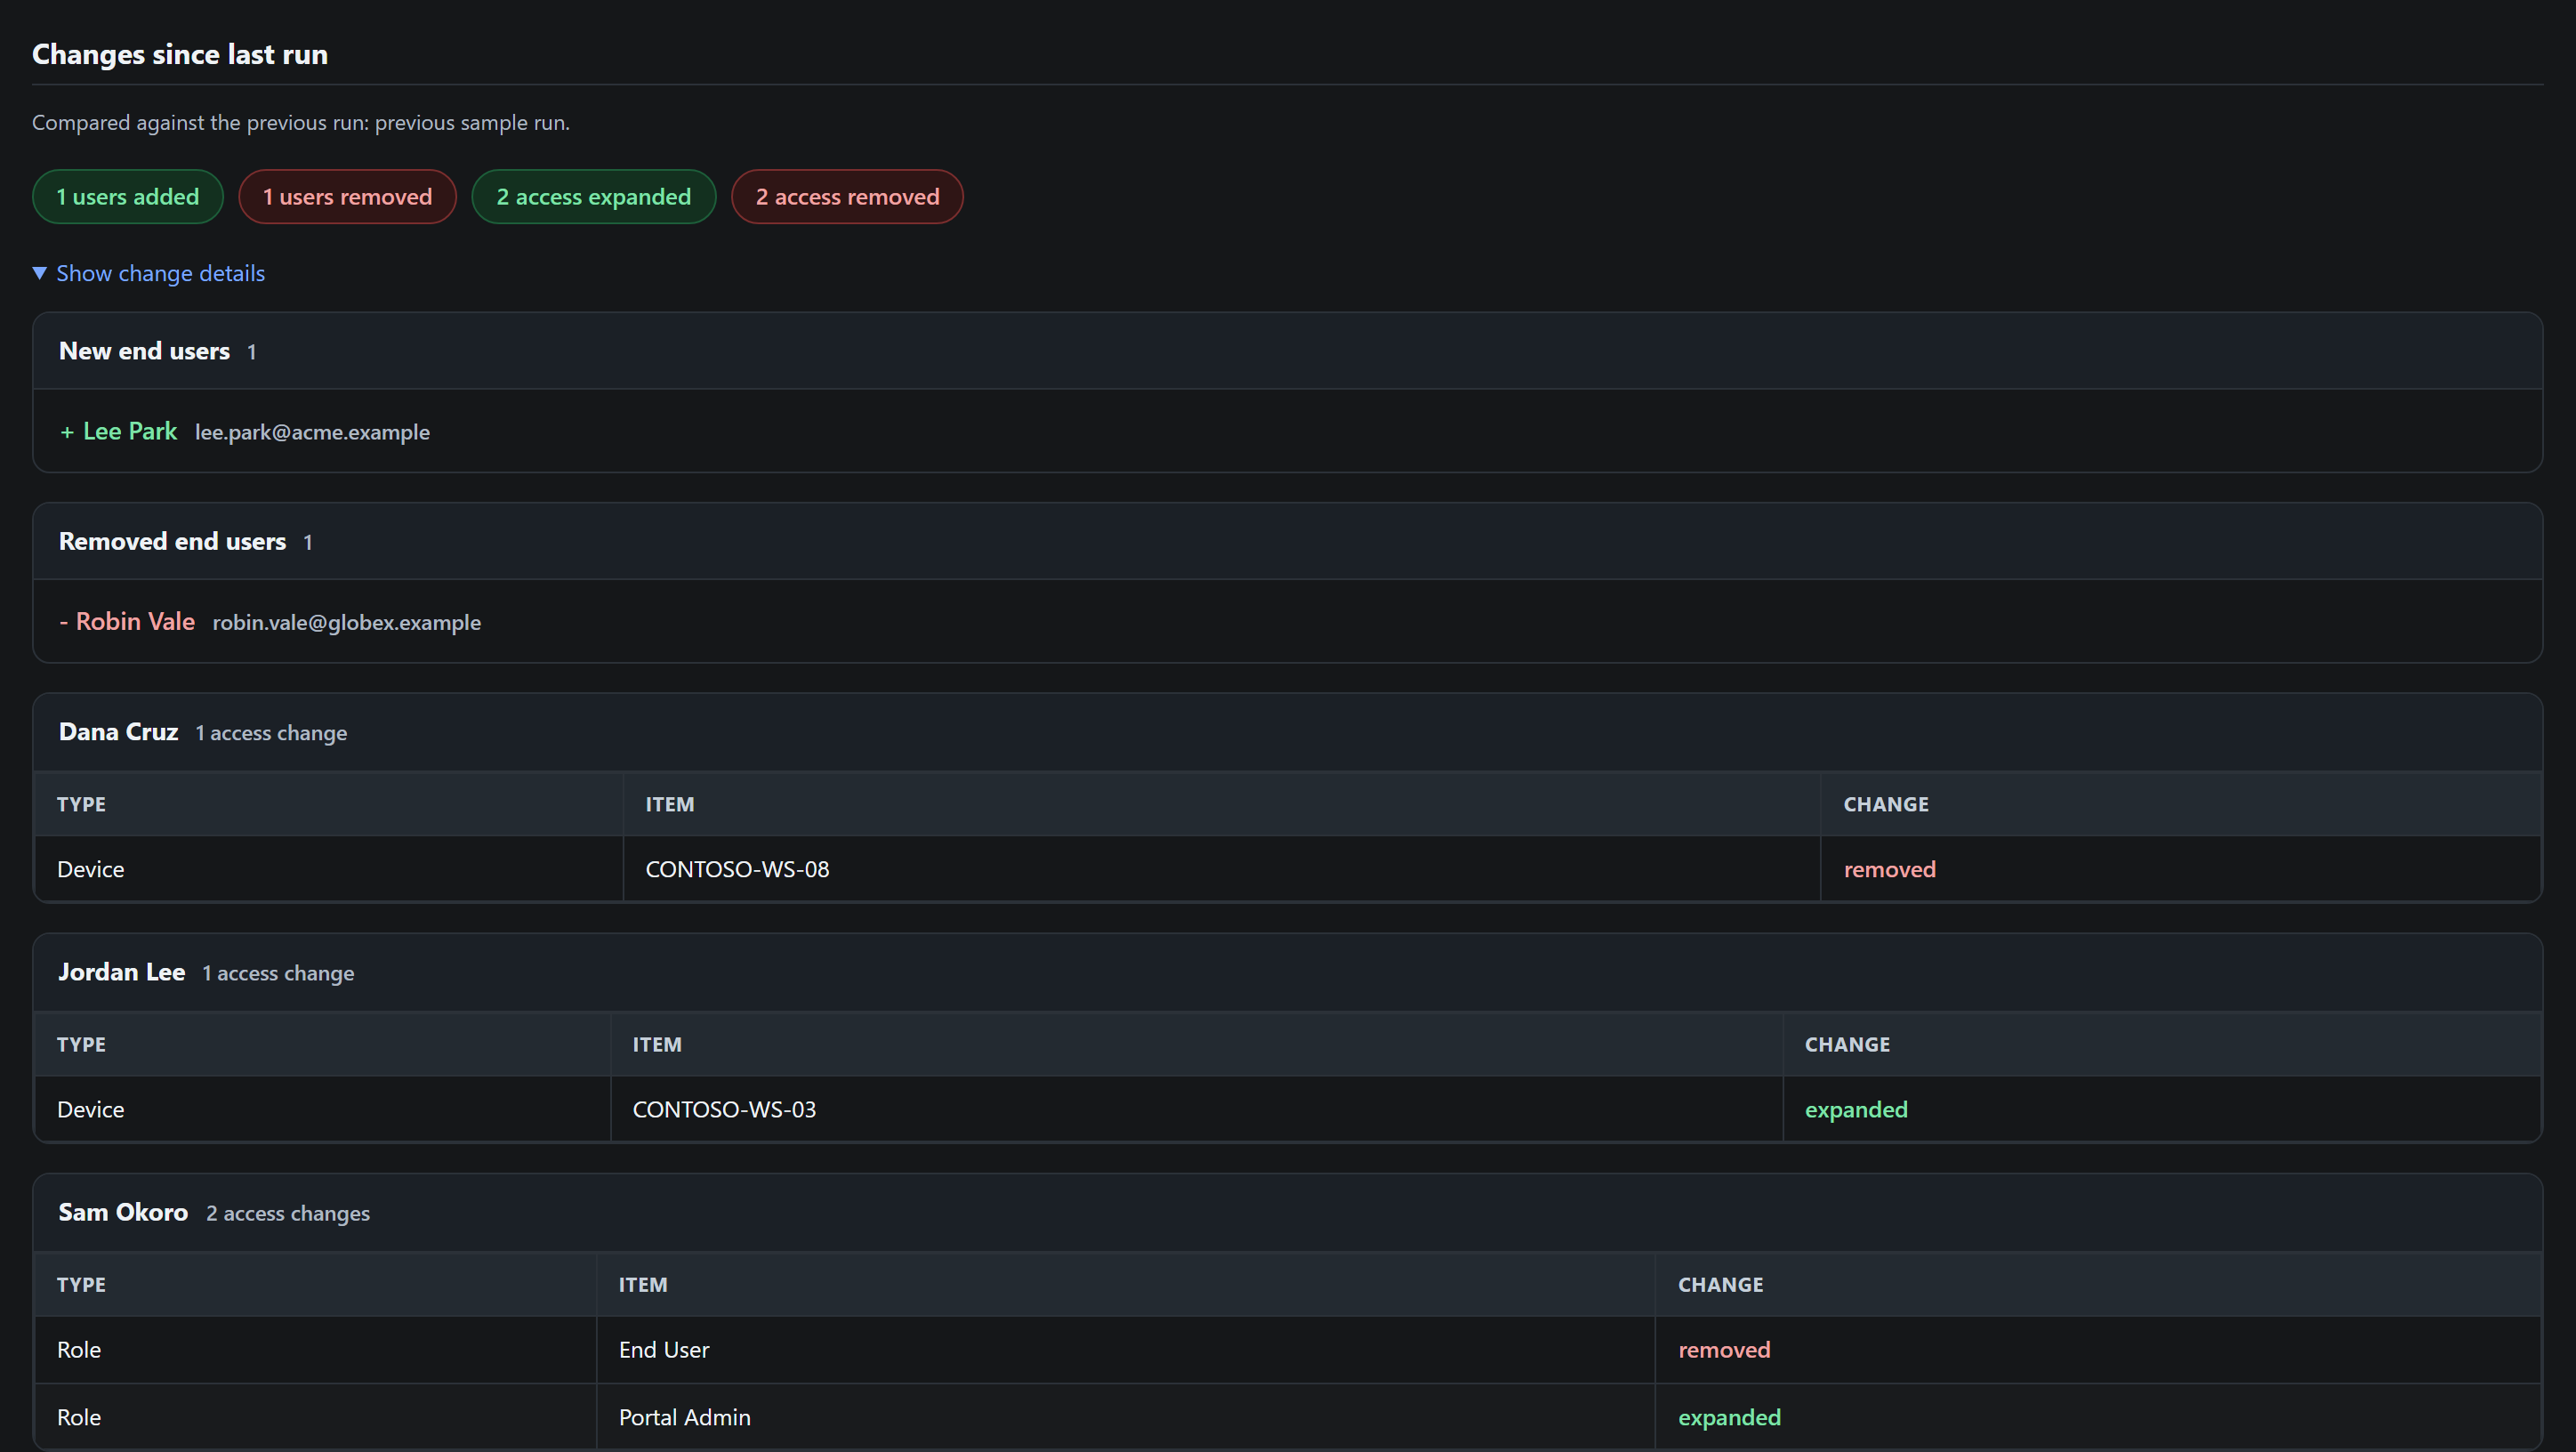
Changes since last run: chips counting users added and removed and access expanded and removed, with per-user tables showing each role or device change direction-colored.
Drift

Changes since the last run

What it does: every run auto-compares against your previous run and reports users added or removed, and role and device access expanded or removed, per account.

What it gives you: headline chips with the detail collapsed until you ask for it, plus a diff.csv of the same changes. The first run simply records a baseline.

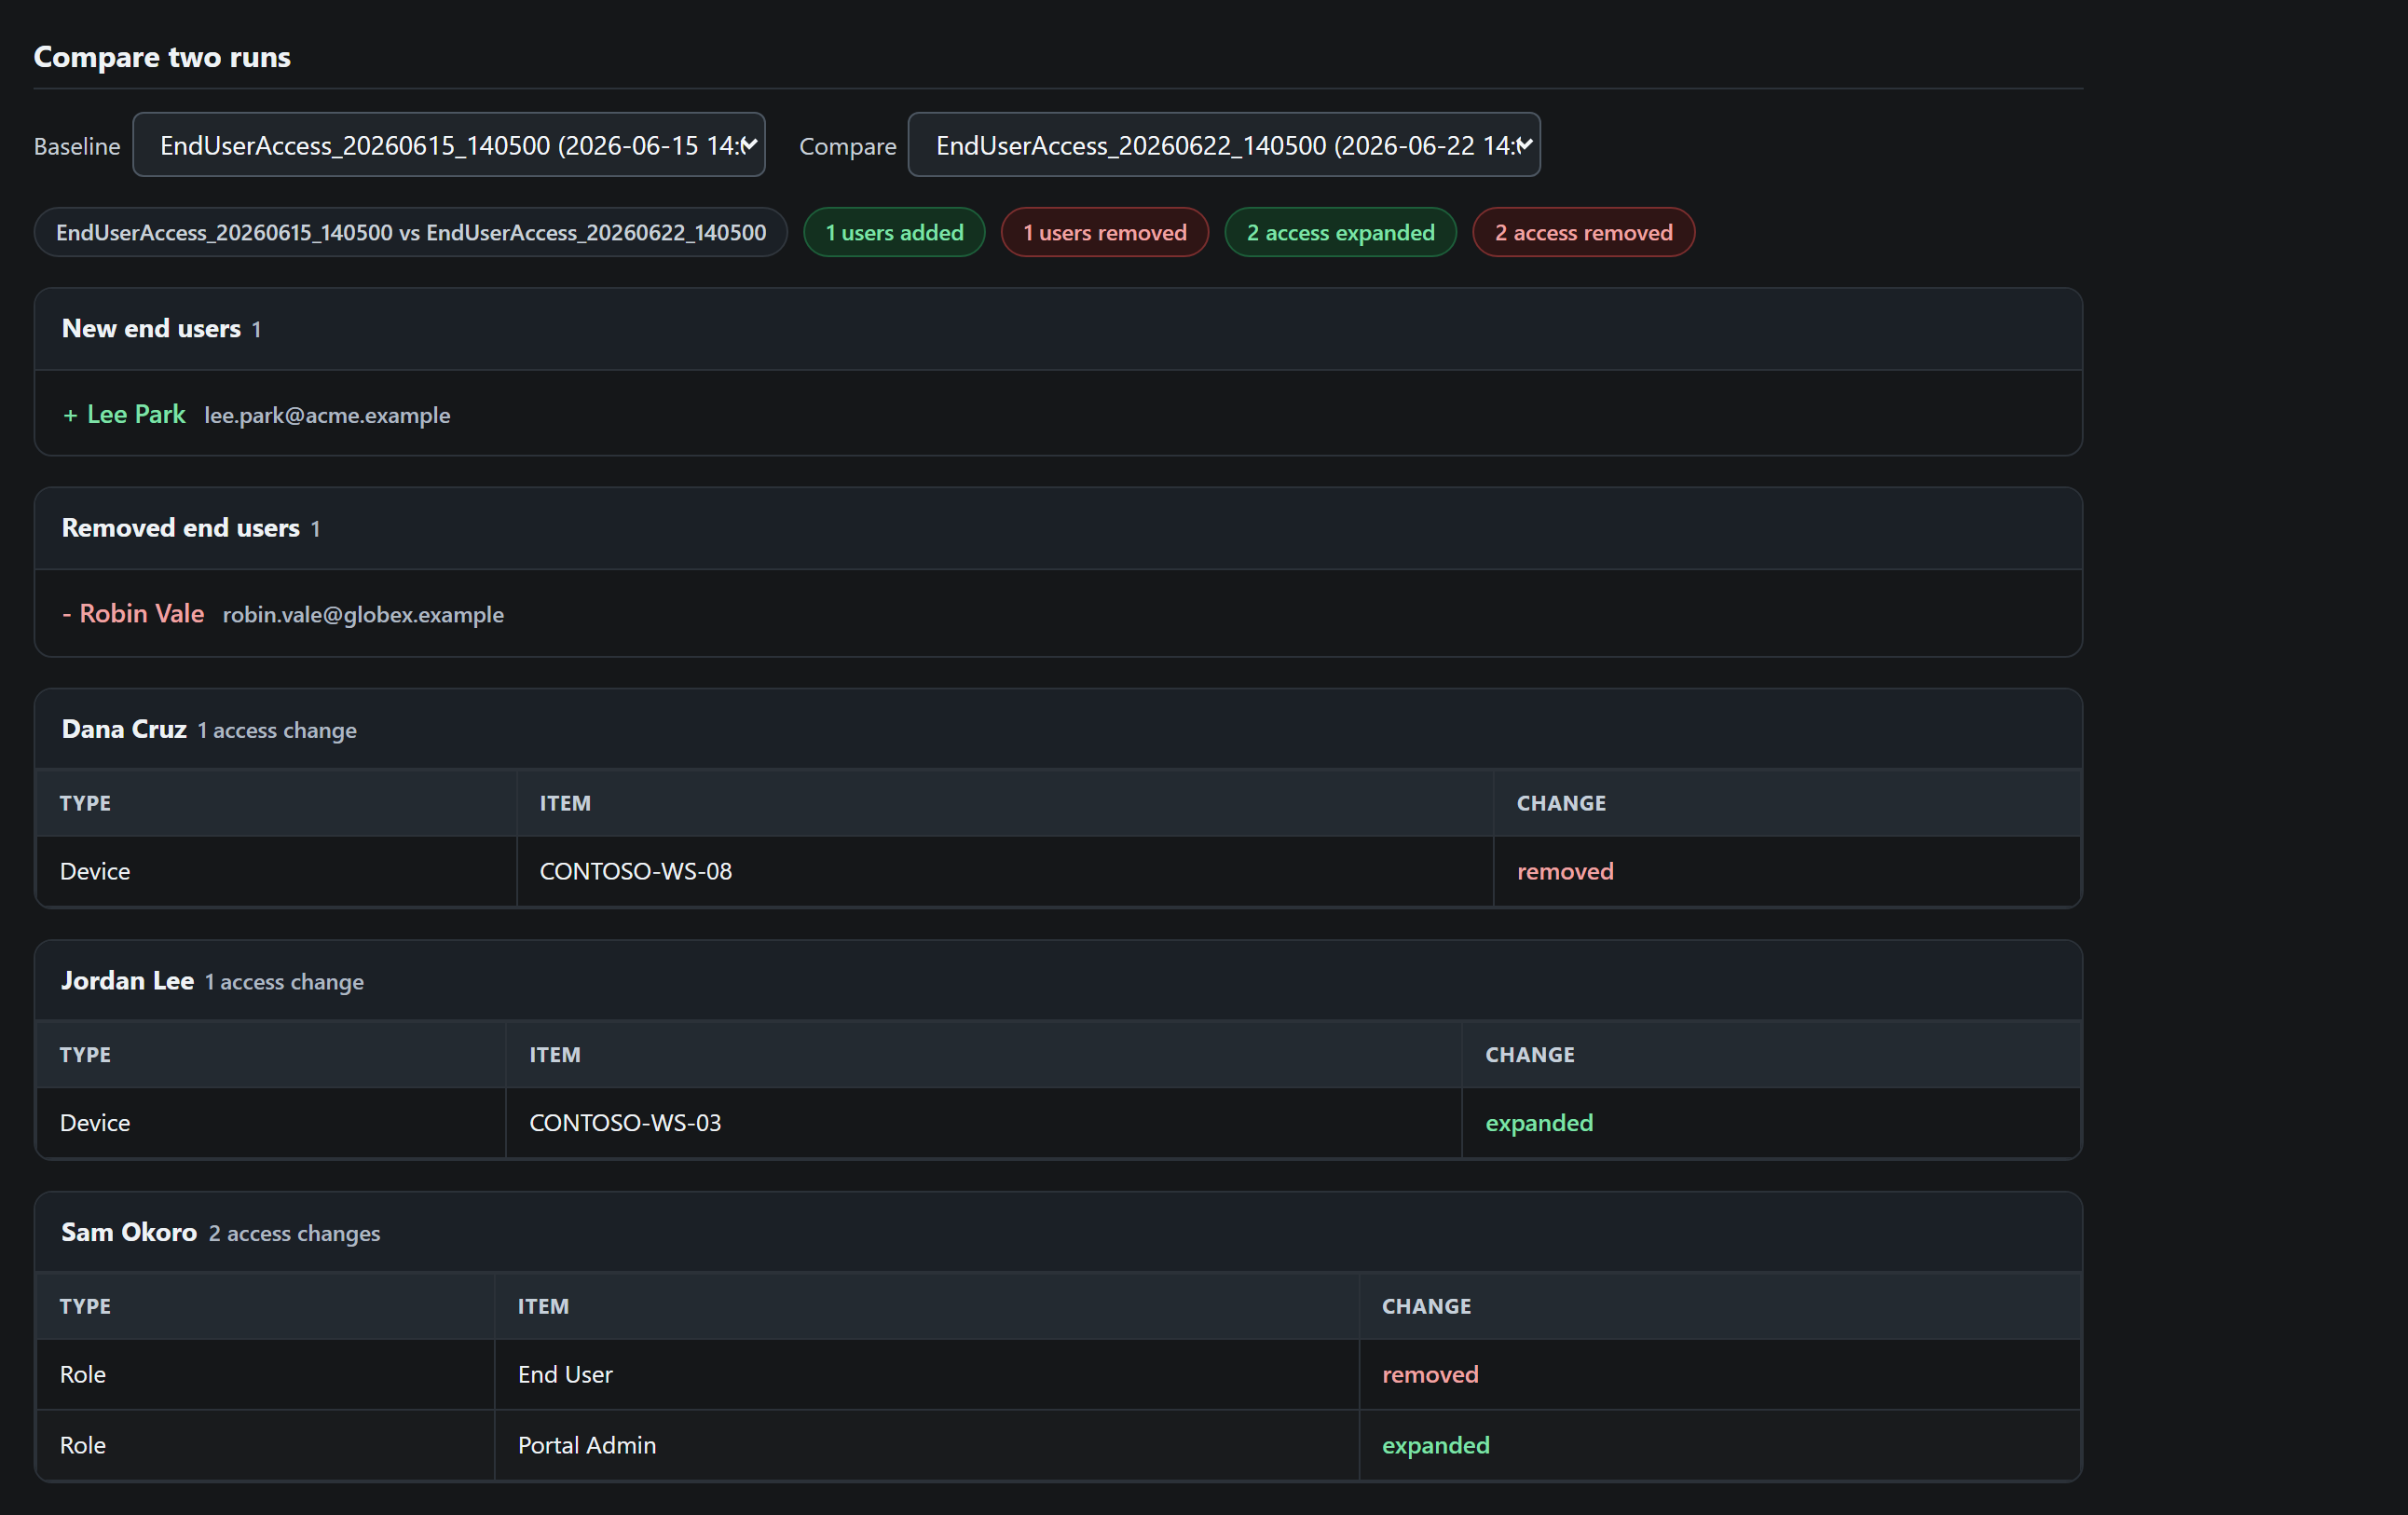
Run history page with a Compare two runs panel: baseline and compare dropdowns and an inline diff listing users added and removed and per-user access changes.
History

Compare any two runs

What it does: keeps every run in its own dated folder and regenerates a history page listing them all, newest first.

What it gives you: pick any two runs and the full access diff renders inline - entirely client-side, working straight off the files on disk - so a quarterly review is not limited to comparing against just the previous run.

Inside a run

Exactly what each run produces.

One run writes a timestamped folder containing the interactive report and its machine-readable exports, then refreshes the shared history page.

The report

One self-contained HTML file - the summary cards, the changes-since-last-run section, and the full end-user table with sorting, filtering, expandable sign-in histories, filtered CSV export, and print-to-PDF.

  • Honest sign-in data: NinjaOne has no last-login field, so sign-ins are recovered from the activity log. The report states how far back the log actually reached, and an account with no events reads “No sign-in on record” - within the log’s coverage, never “never signed in.”
  • No MFA column, on purpose: NinjaOne enforces MFA enrollment on native sign-ins, and for SSO accounts MFA lives at the identity provider where NinjaOne cannot see it - so the column would carry no signal. The auth type (NATIVE vs SSO) is shown instead.

Files written each run

FileContents
end-user-access.htmlThe interactive report - the one file to open.
end-users.csvOne row per end user: identity, org, roles with sources, access scope, devices, sign-in history.
by-device.csvThe inverse view: each device and the end users who can reach it.
roles.csvEnd-user role reference with member counts.
end-users.jsonFull records for downstream automation.
diff.csvOnly what changed since the previous run.
index.htmlRegenerated every run in the parent folder: the run history with the compare-any-two panel.

See it work

Every part of the report, in under two minutes.

A screen recording of the actual report being driven against a fully fictional tenant - clicking a summary card to filter the table, focusing one organization, expanding an account’s sign-in history, opening the changes-since-last-run detail, and comparing two saved runs on the history page. Every click is a real control.

The tool writes two kinds of file, both real and interactive on fictional data here: a per-run report and a single history page that compares any two runs. Both open in a new tab.

How it works

A read-only, four-phase flow.

Authenticate with OAuth2 client credentials, collect organizations, devices, end users, roles, and sign-in activity over GET requests, analyze access scope and the diff against your previous run, then write one report and its exports. Each run becomes the baseline for the next.

Architecture diagram: Authenticate (OAuth2 client credentials, monitoring scope), Collect (GET organizations, devices, end users, roles, activities), Analyze (classify device scope, build sign-in history, diff vs last run), Deliver (interactive HTML report plus CSV and JSON exports and a history index), with a read-only boundary and a re-run loop.

Every API call is a GET against the public API v2; the OAuth credential carries the read-only monitoring scope, which cannot modify the tenant. The client survives real-world API behavior: it pages until an empty batch, retries transient failure responses instead of silently truncating, and de-duplicates overlapping activity pages.

Trust & safety

Read-only by construction, honest about its data.

The credential, the transport, and the report copy are all designed so the tool cannot overstate what it knows or touch what it audits.

Read-only scope

Authenticates with OAuth2 client credentials carrying only the monitoring scope and issues only GET requests - the credential itself cannot modify the tenant.

Secrets stay out of task definitions

Credentials resolve from environment variables, NinjaOne Secure custom fields (readable only during agent automation), or a masked interactive prompt - never from a visible script variable, and never hard-coded.

States its own coverage

Sign-in claims are bounded by NinjaOne’s activity-log retention, so the report prints how far back the log actually reached rather than implying a complete history.

Honest about scope. The report covers end-user accounts only - technician access is a different problem with different API coverage, handled by the companion Technician Permissions Reporter. “No sign-in on record” means none within the retained activity log, not proof the account never signed in. And a device id that no longer resolves is labeled Unresolved rather than being silently counted as cross-org access.

In practice

From credential to finished report.

The tool is one PowerShell script that runs on a Windows workstation, or unattended as a NinjaOne scheduled automation on a management endpoint. It needs a NinjaOne API client application (machine-to-machine, client credentials, monitoring scope only) - created once under Administration → Apps → API.

Inside a single run

Authenticate

The script finds its credential - environment variables if set, NinjaOne Secure custom fields when running as a scheduled automation, or a masked prompt when run by hand - and exchanges it for a read-only bearer token held in memory for the run.

Collect and analyze

It reads organizations, devices, end users, and end-user roles, then walks the retained activity log for portal sign-in events. Device access is classified against each organization’s inventory, and the result is diffed against your most recent prior run.

Deliver

It writes the interactive report, the CSV and JSON exports, and the change diff into a timestamped folder, then regenerates the run-history page. Exit code zero on success; a failed run fails loudly rather than shipping a silently incomplete report.

Every run after the first

Re-runs diff automatically

Each new run auto-selects the most recent prior run as its baseline and reports exactly which users and which access changed since then. The very first run simply records the baseline.

Schedule it, or do not

Cadence is yours: run it ad hoc from a workstation, or let a NinjaOne scheduled task on a management endpoint run it unattended with the credential in Secure custom fields. The history page accumulates either way.

This walkthrough documents how the tool operates; it is not currently published for self-service use. The live sample report and run history above are the best way to see what a run produces.